
What do Mark Zuckerberg, Martin Luther King, and Milton Friedman all have in common?
That’s right, they are all famous Americans whose names begin with the letter M.
Also, they are all proponents of some form of basic income.
A Universal Basic Introduction
The universal basic income (UBI) [1] has become trendy. It is the ultimate unconditional cash transfer. Each member of a society gets a cash payment. Since it’s given in cash, there are no restrictions on what this payment should be spent on, nor are there restrictions on who gets it. Rich and poor get the same amount, regardless of their income.
Sounds nice. It probably is. A basic income could alleviate poverty, reduce inequality, be more efficient than our current welfare system, and provided greater freedom and autonomy for recipients.
It also sounds expensive.
A Note: UBI and the Minimum Income
Related to the basic income is the concept of a minimum income. A minimum income provides an income even if someone has no other source of income. Unlike the universal basic income, it phases out as income increases, though never sharply enough so that it is not beneficial to have market income.
There are certain tax structures that, combined with a basic income, have equivalent redistribution impacts as a minimum income. For this post, I’ll be examining the universal basic income, trying to figure out how much it would cost, and how to pay for it.
$12,000
I’m going to assume that the basic income would give every American over eighteen $12,000 and those under eighteen $4000 a year. These are about the amounts that define the federal poverty line, and most of the examples of an American basic income I’ve seen use numbers around this. One nice feature of giving everyone an amount equal to the poverty line, is that the official poverty measure would go to 0%, which is a pretty nifty accomplishment[2] no matter how you look at it.
There are about 320 million people in the United States. About 73 million are under eighteen. If everyone under eighteen gets $4,000 and everyone over gets $12,0000, the amount given away is $3.4 Trillion.
No way around it, $3.4 Trillion is a massive amount of money. It’s about the GDP of Germany. In US terms it’s 16% of GDP, and just a bit less than all current federal spending.
Replacement
One of the attractions of a basic income, especially among the more libertarian minded, is that it could replace some, if not all, of the current social welfare programs. This might have efficiency gains, (one no longer needs to pay the bureaucrats to administer these programs, and they could go and collect UBI instead.)

A poverty line level basic income, using existing revenue, requires huge cuts to, well, pretty much everything.
Federal welfare spending (housing, food stamps, unemployment etc. is around $370 Billion[3]. All of this would be replaced by a basic income. Unfortunately, it only provides a tiny fraction of the amount needed.
If basic income is intended to replace Social Security as well, that would add just a bit under $1 Trillion. At this point we still aren’t halfway to the cost of the basic income, and have run out of obvious federal spending to replace.
So, on to non-obvious things..
The defense budget is far too big, and just encourages bad behavior, that’s another $600 billion, Veterans’ benefits, they can just get the basic income like everyone else, $160 Billion.
Medicare and Medicaid make up about a $1Trillion, but we probably should leave it. $12,000 isn’t going to go too far when covering medical bills. However, with current revenues, there is no way to get enough money for a basic income without taking all the money from Medicaid and Medicare.
Even if we assumed health spending, social security, all current federal welfare programs, veterans’ spending would all be replaced by the UBI, and we cut the defense budget to zero, it still doesn’t add up to $3.4 trillion.

Data From: National Priorities Project
Taxes
For the basic income to happen there need to be some tax increases.
The details on how the tax structure would be changed matter. Given how complicated the US tax system is, and the nearly infinite ways in which a tax system might be designed, it’s difficult to say exactly what the impact would be.
It is possible to say something about the scope of funds that would need to be raised. The tax increases to cover the basic income would need to be substantial.
A fully robust basic income, without other cuts, would bring government spending from around 40% of GDP to about 60%, which would be higher than any other OECD country. Even if $1.5 trillion can be offset by replacing social security[4] and current welfare programs, basic income adds about $2 trillion to spending, bringing total government spending bringing it to about 45% of GDP[5]. This would bring US government spending up to a level roughly equivalent to The Netherlands.
While the Dutch seem to do fine with their level of government spending, this increase in taxation would be monumental for the US and almost certainly politically impossible. Even for those comfortable with Dutch levels of government spending, it is not obvious to me that a Basic Income is the best use of this spending.
This might be especially important in terms of fighting poverty[6]. Reallocating welfare money to the Basic income would take money that is currently targeted only toward the poor (our current welfare system), and redistribute it upward, spreading it among all members of society. Many poor people are eligible for assistance or benefits that amount to more than they would receive under a UBI scheme.
Technology
One of the reasons people argue in favor of the UBI, is the idea that soon automation and technological improvements will make jobs obsolete. In the most extreme examples of this future, humans will be inferior to robots or algorithms at every job.
We should be so lucky.[7] But we aren’t there yet. Not even close.
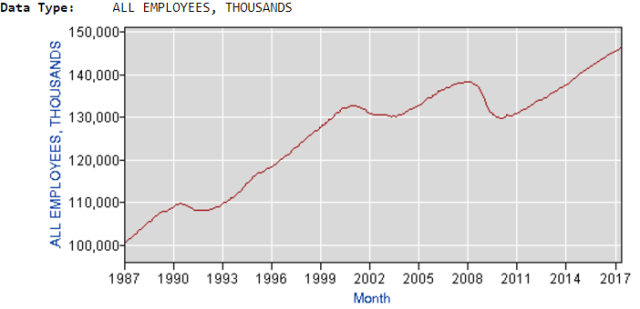
While this topic is a bit much to really get into in this post, I’ll just note that the total number of people employed in the United States is the highest it’s ever been. Unemployment is low, productivity is growing slowly. All of which point to continued employment, at least for the present and near future.
We may yet arrive at this world, but we haven’t yet, and when we do the robots will be better at designing policy than us anyway.
When?
If my chief objection to the UBI is its cost, the obvious question is how much would it need to cost to be worthwhile. I don’t have a perfect answer for this. The most expensive government program, Social Security, is about 5% of GDP. A basic income that cost about this much would provide each person with a couple of thousand dollars a year. Not enough to live on, but a meaningful amount for many people. At this level, we would almost certainly need to maintain most current federal services (although some of them such as SNAP could be converted into cash transfers).
Maybe we could afford it at 10% of GDP. To provide $12,000/year to every adult without spending more than 10% of GDP requires a GDP of $34 trillion, a little less than twice what we have now. At a growth rate in real GDP of 2% per year and a population growth rate of 0.5% per year, we would get there a bit after 2050[8].

A Cheaper Basic Income
There two ways of making basic income cheaper. One is reducing the amount that gets paid out, but if it really is supposed to be an amount that someone can survive on, anything under the amounts mentioned above is probably not going to cut it.
The other way is make it not universal. This would be akin to a minimum income, or negative income tax. This is similar to the basic income in that it establishes a cash floor for recipients, but fundamentally different in that it is means tested and not universal.
Can We Afford a Universal Basic Income?
A universal basic income would require both substantial tax increases and for the basic income to replace current government. While I am sympathetic to the promises of a basic income, I have a hard time justifying the expense.
At least for now.
RELEVANT POSTS FROM PARTYSHEEPHATS:
What are some alternatives to the Universal Basic Income?
When is the Minimum Wage too High?
Can the gains from trade be redistributed?
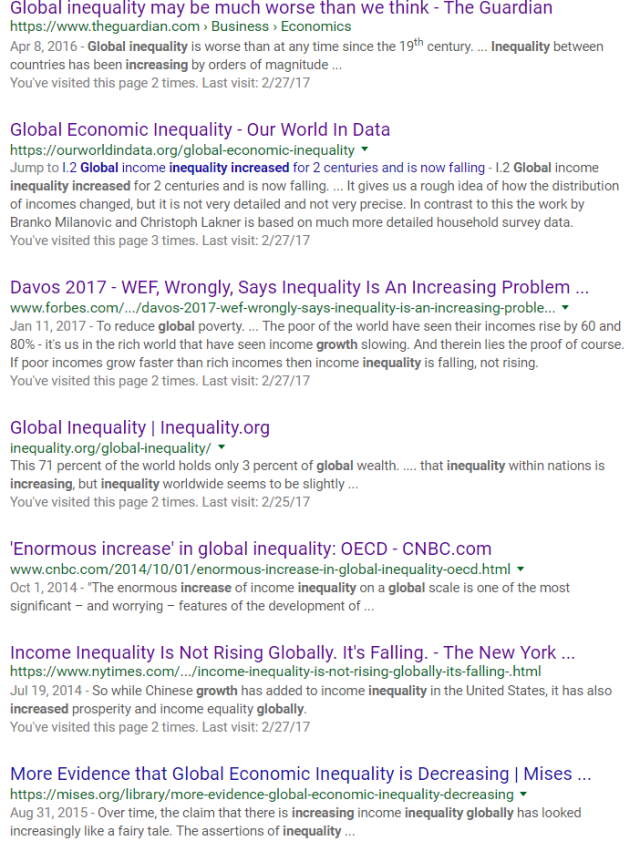
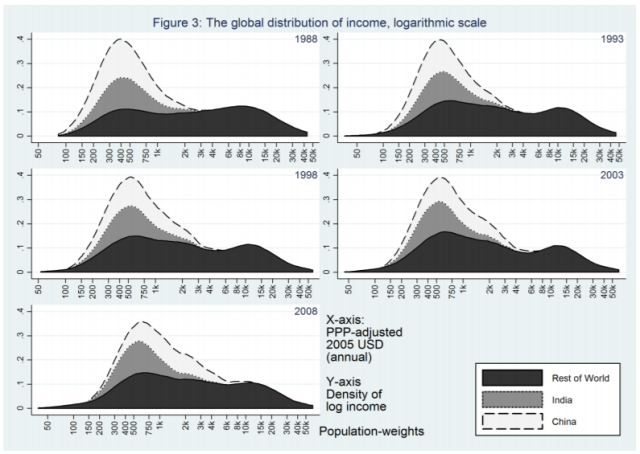
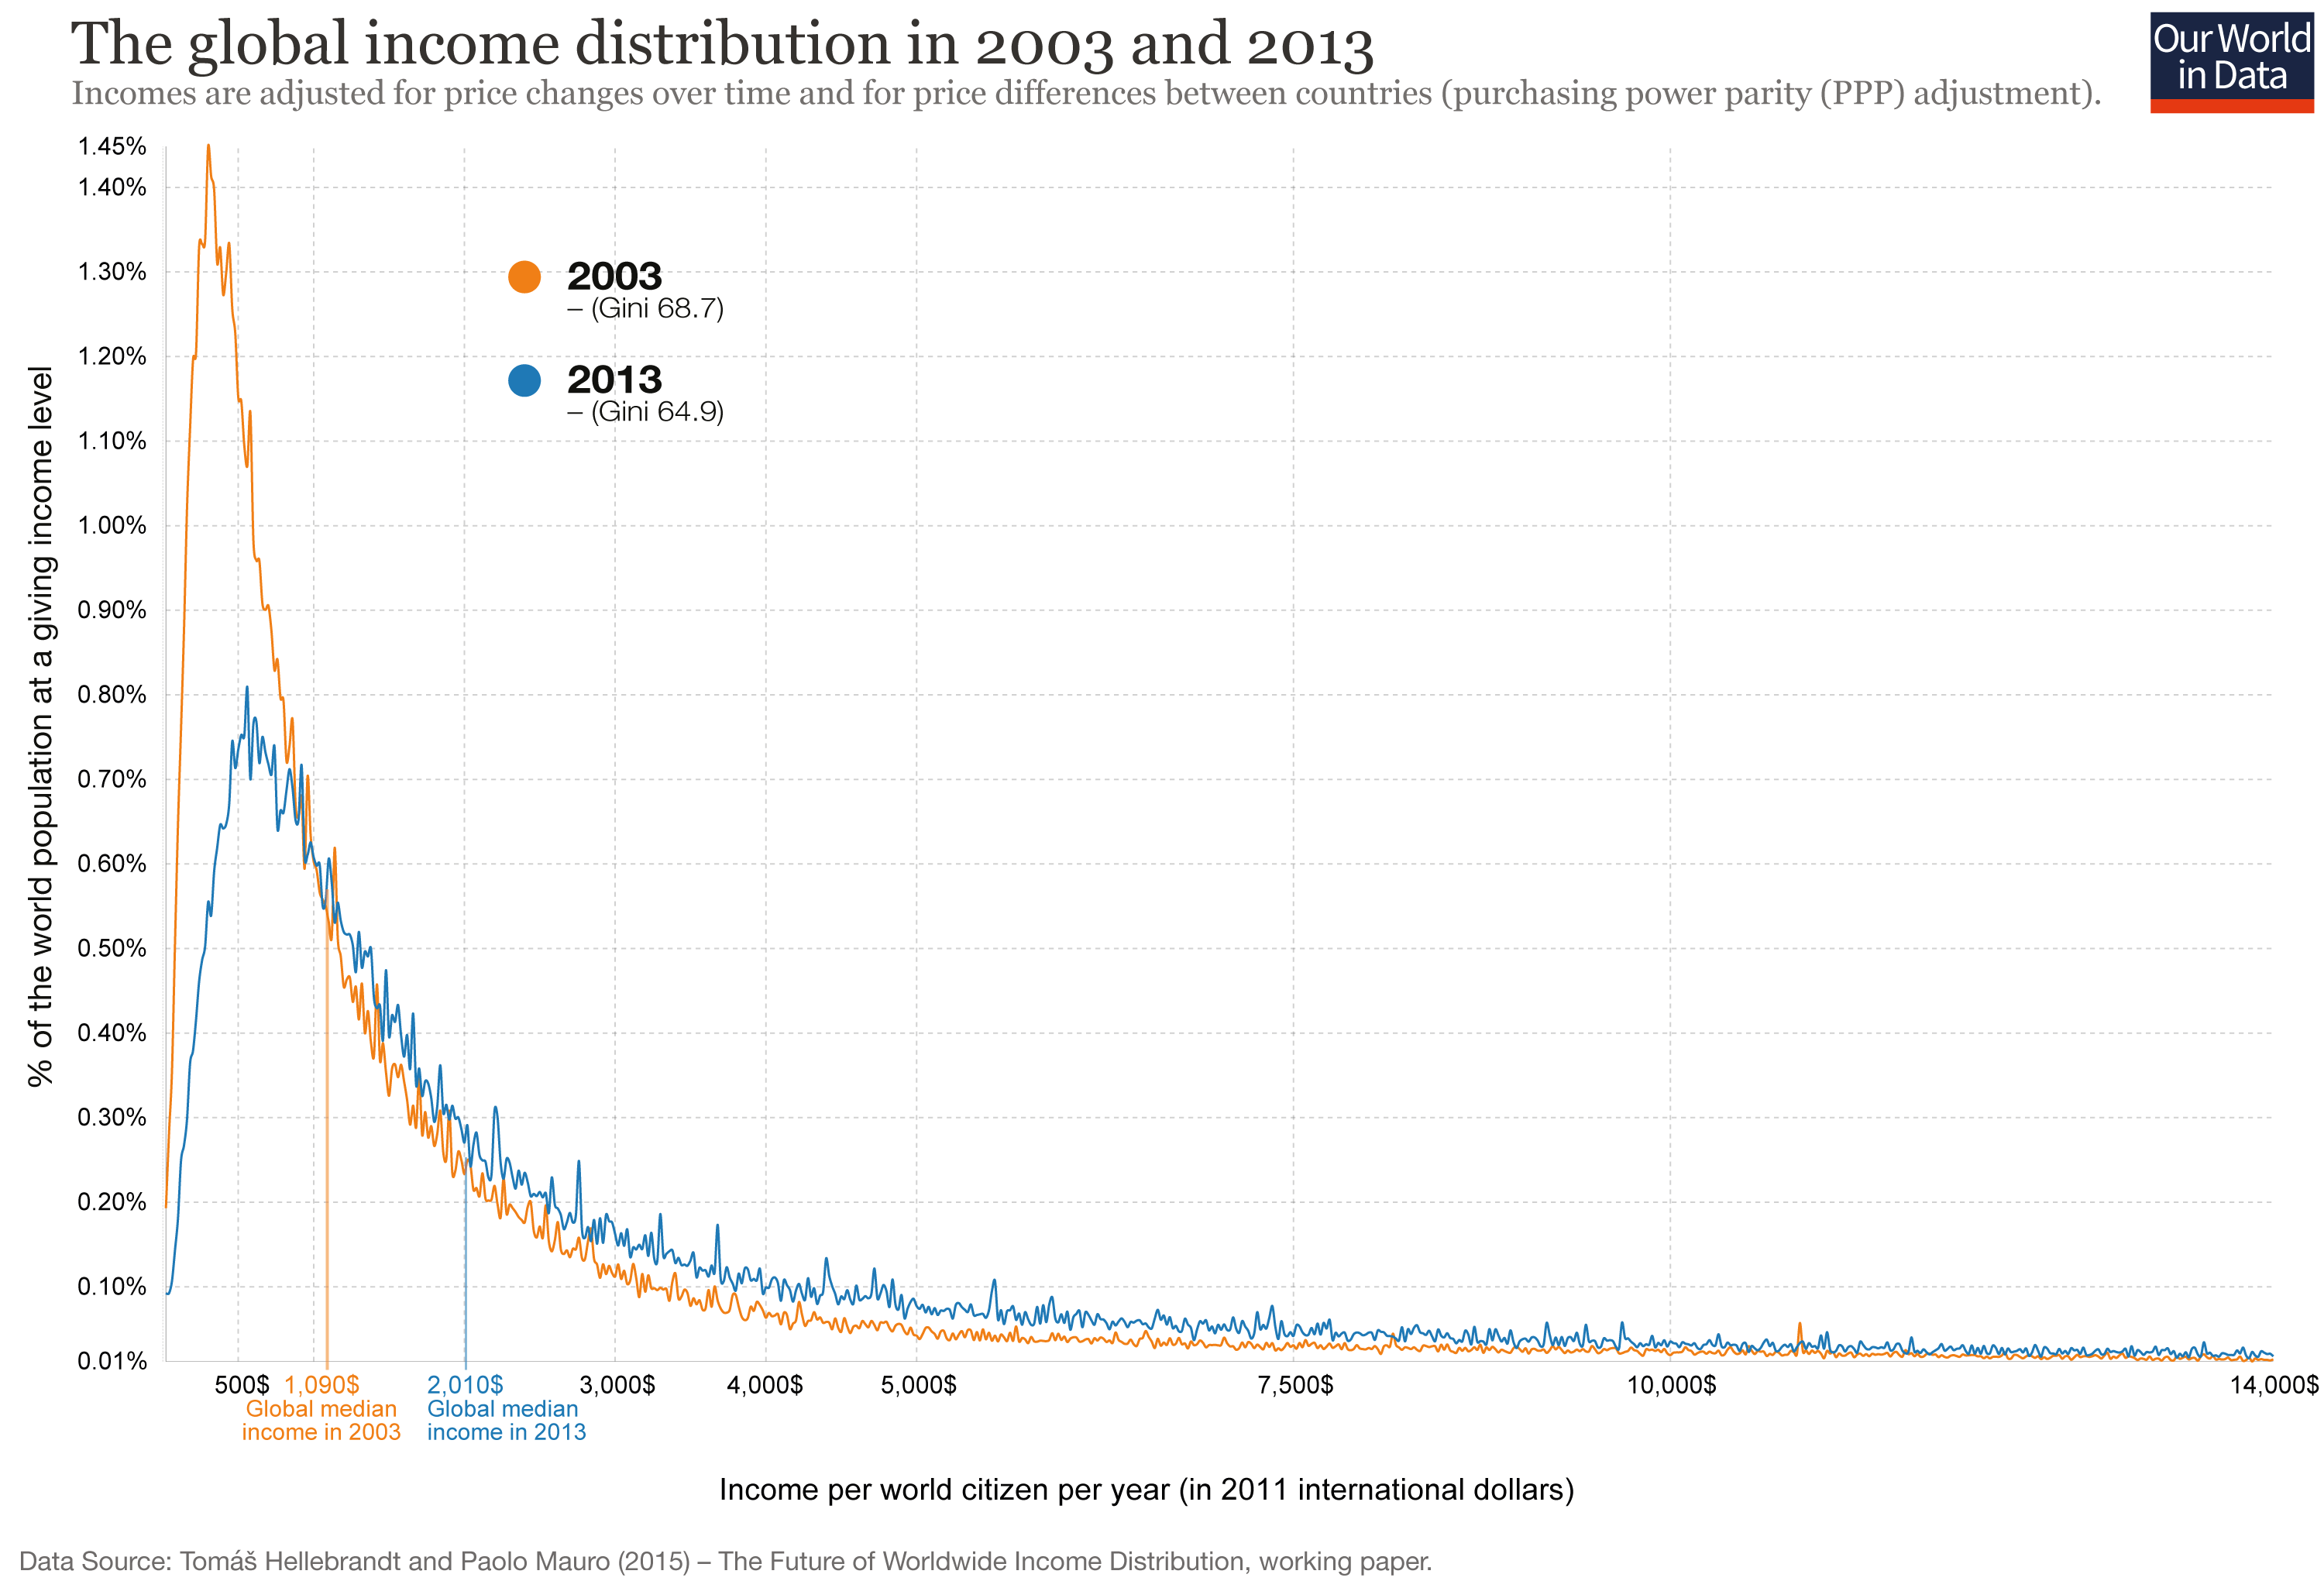
Is Global Inequality Increasing?
[1] There are a few other names for this such as “citizen’s income” which sounds massively more badass.
[2] But perhaps a misleading one, as most poverty measures do not count government benefits.
[3] There is no exact definition for what constitutes welfare spending, so estimates can range widely, depending on whatever point the author is making.
[4] Seems like this would either be a wash or a detriment for social security recipients.
[6] I refer to poverty in the US. For fighting extreme poverty in lower income countries, the math might work out differently.
[7] Example: Imagine how much better this blog would be if it were written by an algorithm. Do androids dream of electric partysheephats?
[8] This is a super rough estimate. You can fiddle with the assumptions here.
References, Sources, and Further Reading:
Forbes.com of course we can afford a universal basic income do we want one though
Futurism.com universal basic income costs less than you might think
www.dailyjournal.net consider universal basic income with an open mind
Cato: universal basic income disease or cure
How to reform welfare and taxes to provide every american citizen with a basic income
Futurism.com Here’s why experts think universal basic income will never work
World Economic Forum can universal basic income actually work
Basicincome.org real cost universal basic income
Vox universal-basic-income-review
Usnews.com a-universal-basic-income-wouldnt-reduce-poverty
cbpp.org/universal-basic-income-may-sound-attractive-but-if-it-occurred

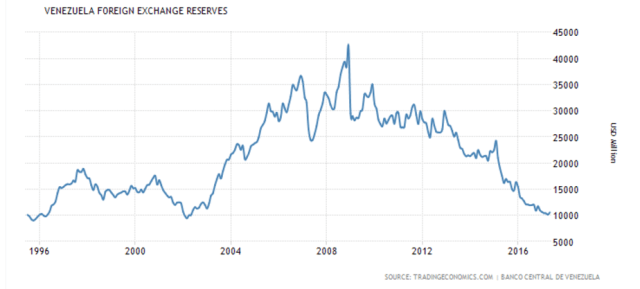
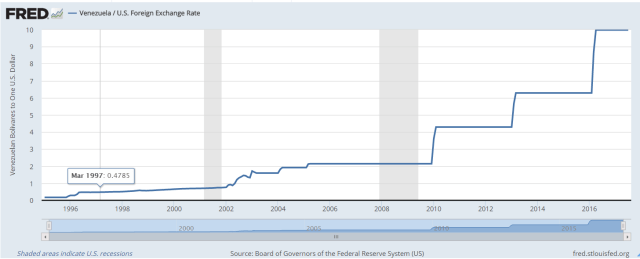
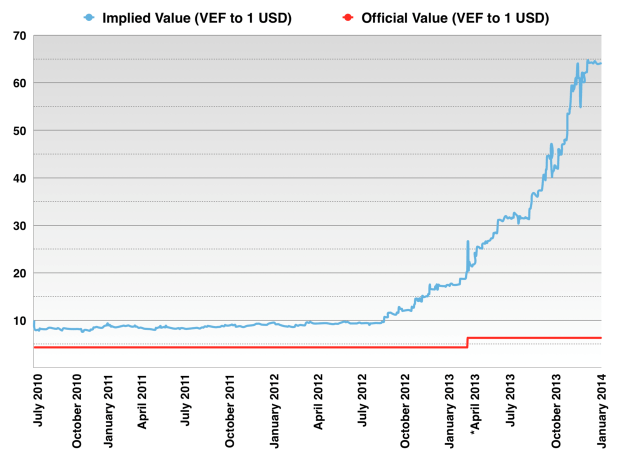
 Currency markets are odd places. They are one of the few financial markets that are zero-sum. Politically, they can be odd as well, the good being exchanged is partially controlled by the government, some countries might want to keep the value of their currency high, others might want to keep it low.


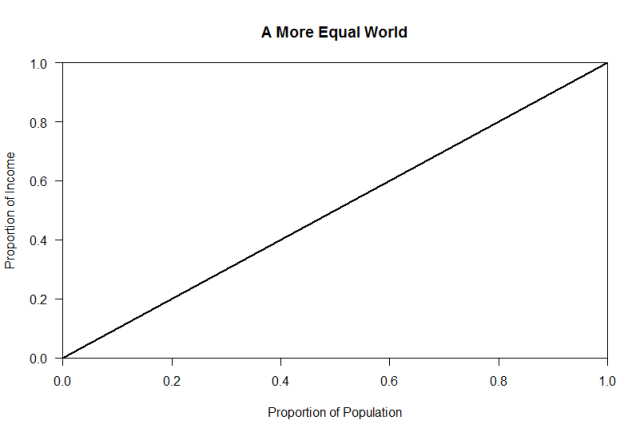

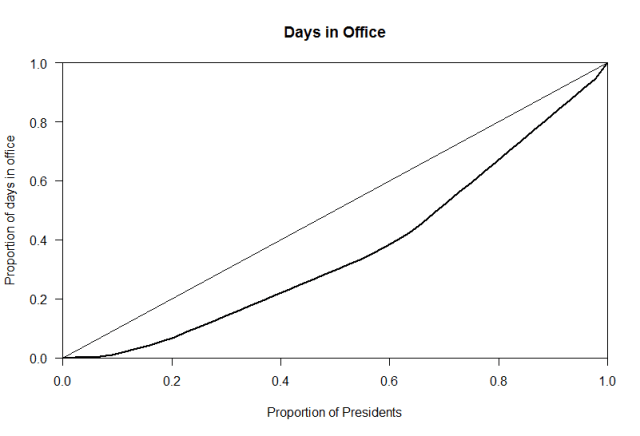
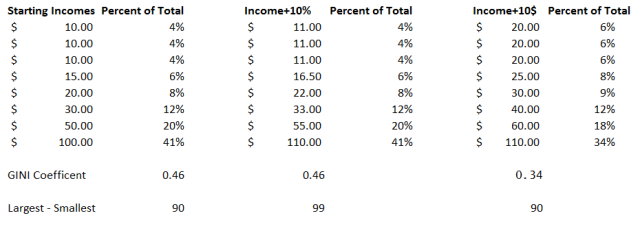
 Gini Coefficient = The dark gray area/(dark gray area + light gray area)


